How To Export Images from Compylations and Calculations
- In Compyle, go to Analytics > All Compylations.
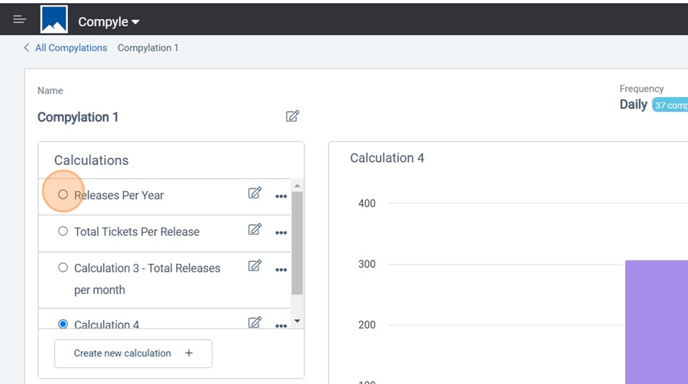
- Click on the name of a Compylation to open it.

- When the Compylation opens, select the first calculation that you need to export the graph from.

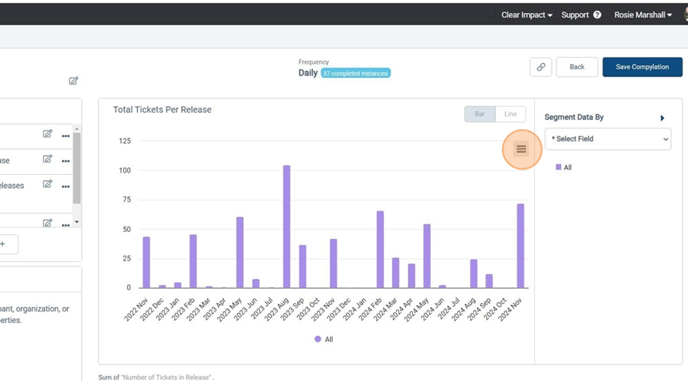
- Once the graph appears, click the hamburger icon (=) to open the chart menu.

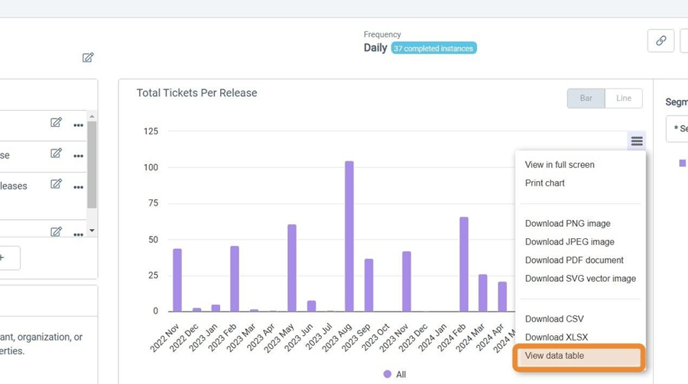
- Select the type of image download desired.

- The image will save to your browser downloads folder.

Downloading the Data for Calculation Summary
- To download data for a compylation, select the calculation using that data.
- Open the chart options menu (=).
- Select View Data Table to see the summaries used to create the graph.
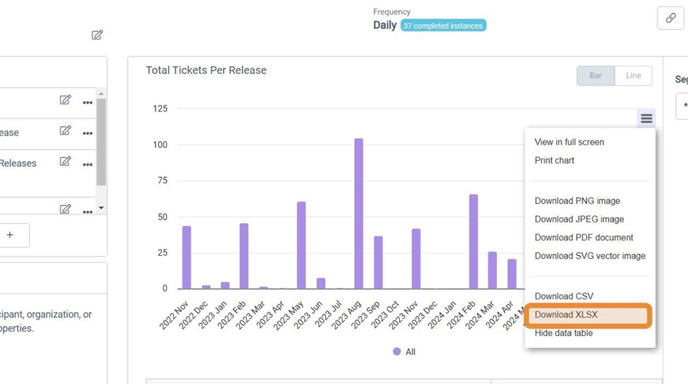
- To download the data for the calculation, open the chart menu.

- Select Download XLSX (Excel) or Download CSV (generic spreadsheet).
- The file will save to your browser's downloads folder. When you open it, the data table information will appear.
