When entering data values into a measure, you can also project forecasted values to display in your data graphss. Adding forecast values is one way to help boost your scorecard’s engagement score.
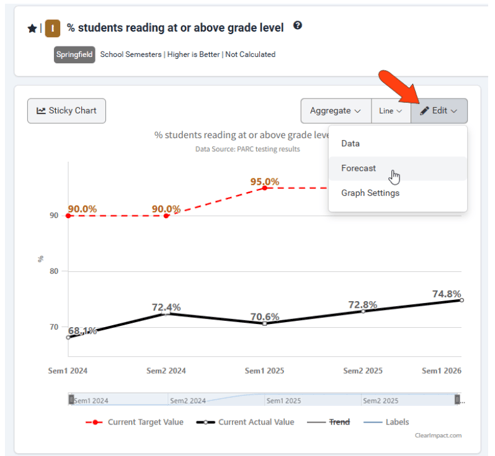
Start by opening the measure, and click Edit / Forecast above the graph.
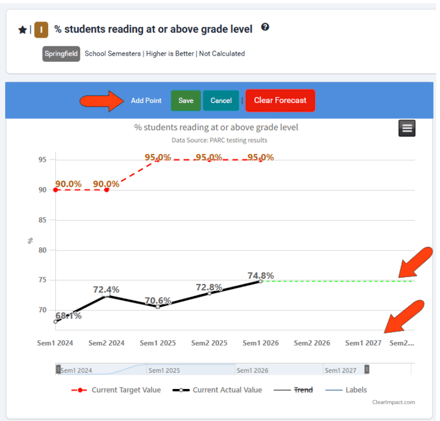
Click Add Point for each new time period you want to add to the graph. This adds a dashed forecast line that maintains the current value by default.
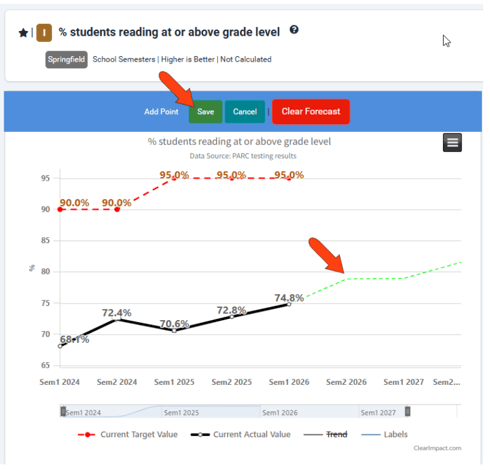
Drag each forecast data point to represent your forecast. When finished, click Save at the top.