If enabled by your admin, AI Assist does a couple things. One is prompt-generated content for notes, the other is graph trend identification and explanation.
Note that the AI Assist option appears when editing a graph for which there are at least 10 data periods
The popup that appears contains AI-generated text like the following:
Analysis of "% of Students Reading at or Above Grade Level"
Data
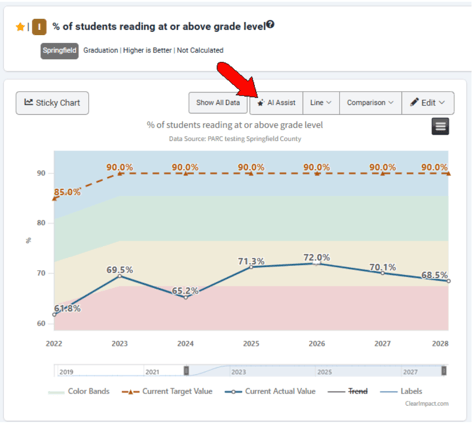
The data shows the percentage of students reading at or above grade level over a period of ten years (2018-2027). The target value varies between 85% and 90% depending on the year. Let's analyze the actual values:
Trends
No significant upward trend:
The data does not demonstrate a clear and consistent upward trend towards the target percentage. There's fluctuation, but no strong indication of improvement over time.
Fluctuation around a mean:
The actual values fluctuate around a mean of approximately 67-68%.
Gap from Target:
There's a consistent and significant gap between the actual values and the target values (ranging from 15-28 percentage points). This gap remains relatively stable over the years.
Linear Projection:
To perform a linear projection, we'll use a simple linear regression to model the trend. A linear projection is arguably not the best model given the lack of a clear upward trend, however, we can still perform the calculation to understand the potential future projection according to this simple model. Keep in mind this projection should be interpreted cautiously.
We'll use the year as the independent variable (x) and the actual percentage as the dependent variable (y). For simplicity, we'll use the last 10 years' data, assigning 2018 as year 0, 2019 as year 1, etc.
| Year (x) | Actual % (y) |
|---|---|
| 0 | 68.0 |
| 1 | 62.0 |
| 2 | 62.0 |
| 3 | 69.5 |
| 4 | 65.23 |
| 5 | 71.3 |
| 6 | 72.0 |
| 7 | 70.1 |
| 8 | 68.5 |
| 9 | 68.0 |
Using a linear regression calculator (easily found online), we can obtain the equation of the line of best fit. The exact coefficients will depend on the calculator used and the method of calculation, but the resulting line will likely show a very small positive or even a slightly negative slope.
Example (Approximate):
Let's assume the regression yields a line of the form `y = 0.15x + 67` (this is an example; the actual values will vary based on the specific regression method).
Using this example equation:
2028 (Year 10):
y = 0.15 10 + 67 = 68.5%
2029 (Year 11):
y = 0.15 11 + 67 = 68.65%
Conclusion:
The linear projection, based on the provided data, suggests very minimal improvement in the percentage of students reading at or above grade level. The lack of a strong upward trend highlights the need for intervention strategies to significantly improve reading proficiency. A linear projection is not a suitable long-term forecasting method for this data because it does not account for potential changes in teaching methods, student demographics, or other factors that might influence reading achievement. More sophisticated forecasting models, potentially incorporating factors beyond simply time, might provide more informative projections. A thorough review of current pedagogical strategies and interventions should be conducted to determine the root causes of the consistent performance gap and develop targeted solutions.