Note: To understand the foundations of calculated measures, we recommend reading the article on creating calculated data before reading this article.
A calculated (also called parent or aggregated) measure uses a mathematical equation to produce its data. The data that goes into the equation is taken from one or more child (disaggregated) measures.
In paid subscriptions, users pay a fee for each measure in their instances. A variable is a no-cost alternative to a disaggregated indicator or performance measure, designed to act as a child measure only.
A variable cannot be used as a stand-alone measure in a result or program container; it can only be used as a data source (child) for a calculated (parent) measure. (A variable can also be used as a compared measure.)
Unlike other measures, variables contain data only - no notes, actions, or file attachments. Variables do not count against the total number of measures in your account.
Note: A calculated measure can take data from only variables, only measures, or a combination of measures and variables.
As with a disaggregated (child) measure, a variable can be created in advance, ready to be added to a calculated measure. But unlike a measure, a variable can also be created on the fly while setting up a calculated measure. Both methods will be shown in the example in this article.
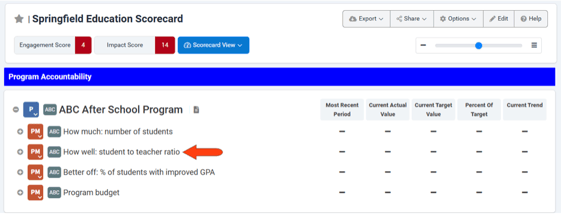
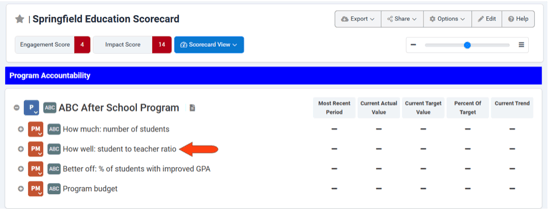
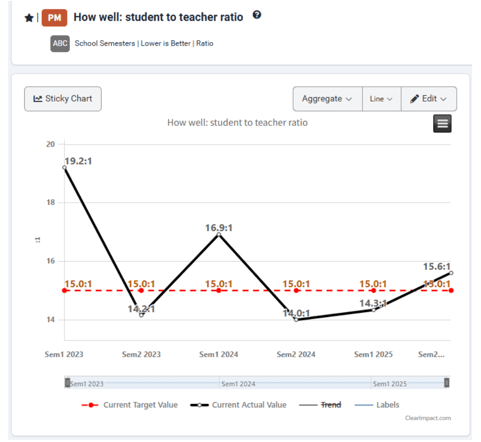
In this example, the performance measure “How well: student to teacher ratio” will have calculated data. The values for this measure each period will be a ratio - the number of students divided by the number of teachers.
This performance measure uses a custom frequency called “School Semesters.” As with measures, all variables used to calculate this measure must also use this frequency.
This calculation will use data from two variables:
- Number of students in after school programs (set up in advance)
- Number of teachers in after school programs (created on the fly)
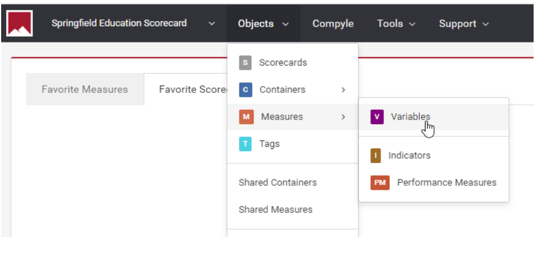
The first variable, for student numbers, will be created in advance. Choose Objects / Measures / Variables.
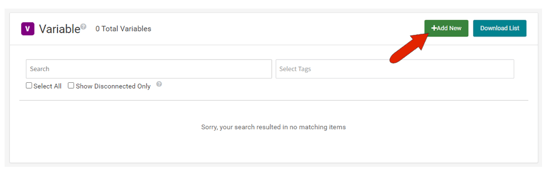
On the Variable list page, click Add New.
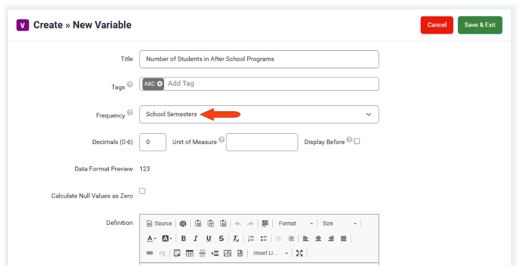
Assign a variable name, add an optional tag, and set the frequency to match the aggregated measure’s frequency. Click Save & Exit.
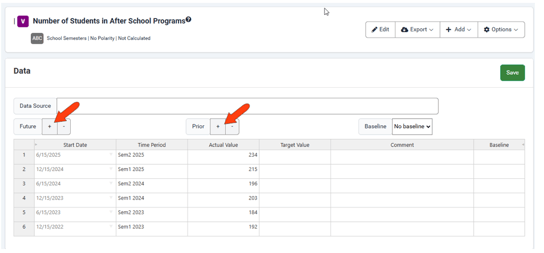
This opens the data table for the variable. To add data rows, click Add for Future and Prior as needed. Rows are added according to the variable frequency. Fill in the data for each cell, and click Save.
With the first variable saved, return to the scorecard and open the measure that is to be calculated. (Or you can find the measure on the Indicator or Performance Measure list and click its name to open it.)
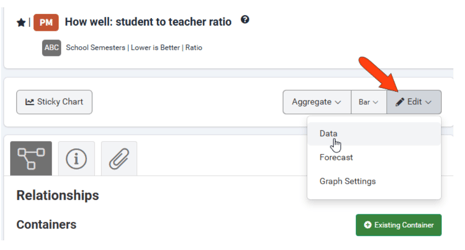
The measure already has the correct frequency, and by default, measures are Not Calculated. Click the measure’s Edit button.
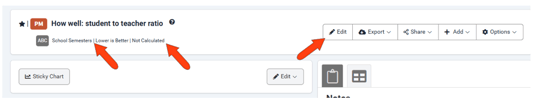
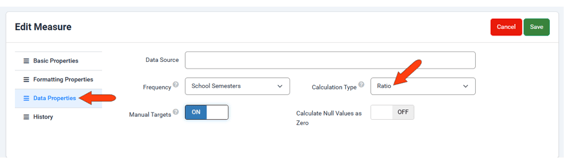
Open Data Properties and set the Calculation Type, which for this example is Ratio. (This is also where you could change the Frequency, if needed.) If the calculated data is to be compared to target values, be sure to enable Manual Targets. Click Save.
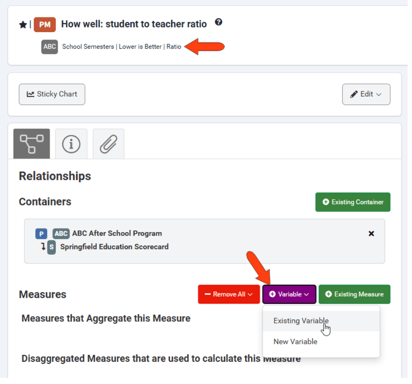
The calculation type is now listed in the measure description. To define the first data source (child or disaggregated measure), click Variable in the Relationships section and choose Existing Variable.
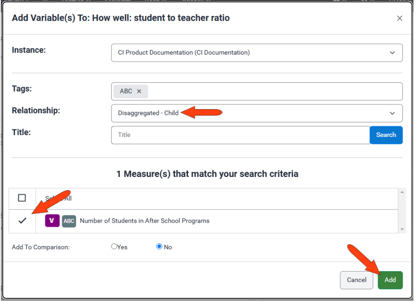
In the Add Variable(s) To window, the Relationship is automatically set to Disaggregated - Child. (A variable cannot be aggregated, or parent.) To find the variable, you can filter by tags or title, then click Search to see the results. Only variables that have the same frequency as the calculated measure will be available for selection. Select the variable and click Add to continue.
Keep in mind that for some calculations, selection order is important. In this example there is only one variable to choose, but if you were selecting more than one at a time, the student variable should be selected before the teacher variable. (Don't worry - if you get the order wrong, it can easily be fixed later.)
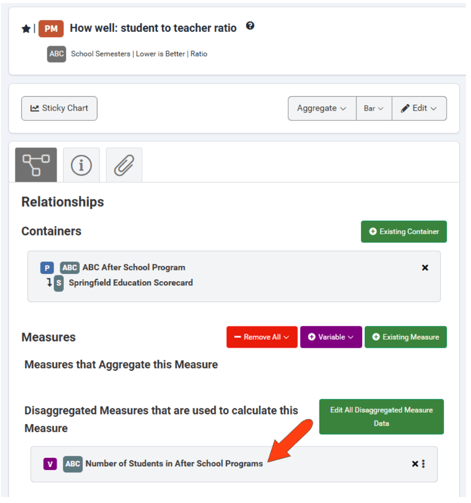
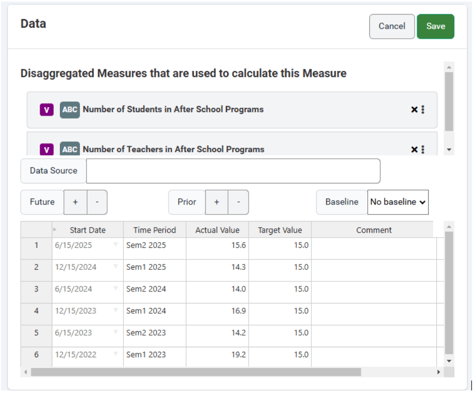
The ratio calculation in this example requires two measures, but only one was added so far - the student data variable. This added variable appears under Disaggregated Measures that are used to Calculate this Measure. No measure data will be calculated until the second measure is added.
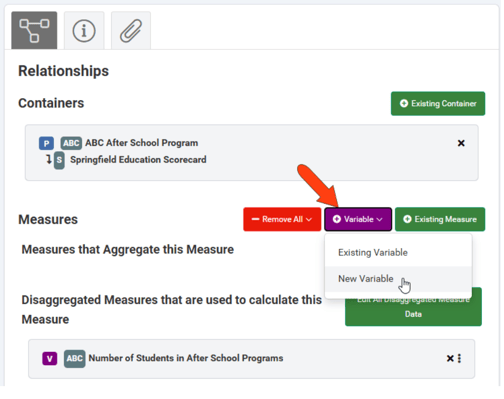
Because the second variable needed for the calculation (teacher data) has not yet been created, click Variable again, and this time choose New Variable.
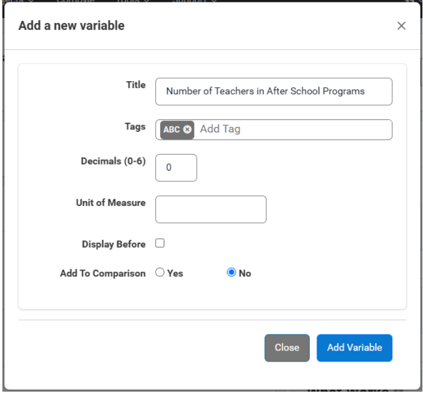
In the Add a new Variable window, assign a name and optional tags. The frequency is taken automatically from the calculated measure. Click Add Variable.
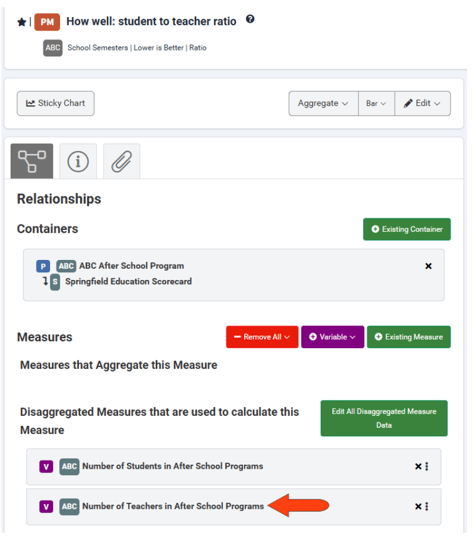
The variable is added as a disaggregated measure in the Relationships section. If the variable order were incorrect, you could drag and drop here to correct the order. The ratio calculations are still not complete because the second variable has no data. To fill in data for this variable, click its name.
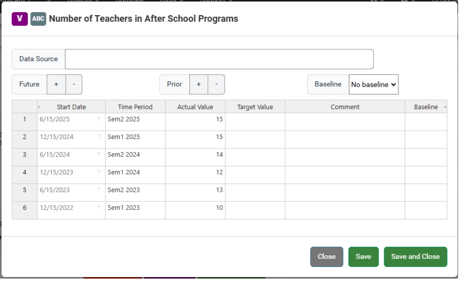
Add the same data rows as for the other variable, fill in the data, and click Save and Close.
Note: the Save option can be used in the case of a child measure who is itself also a parent measure, receiving data from a child measure. Clicking Save enables you to save data while keeping the first-level child measure open.
Now that both variables are defined and have data, click Edit / Data.
Both variables are listed in the Data section, and the Actual Value column should reflect correct ratio values. If the data is incorrect you can drag to correct variables order (student numbers above teacher numbers). You can add target values as well, if enabled. Click Save when finished.
The ratio data graph is now displayed.
Note: There are several ways to edit a calculated measure's disaggregated data.
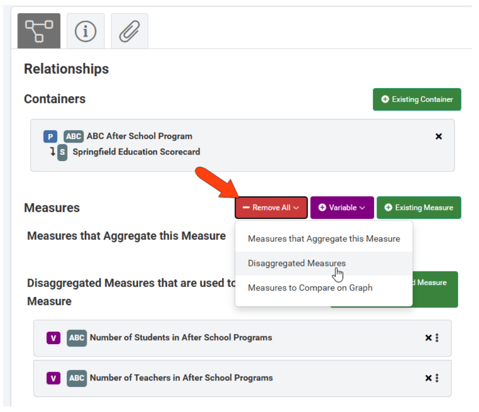
Back in the Relationships section, to start over with new disaggregated variables or measures, you would click Remove All / Disaggregated Measures.