Note: This article covers how to set properties for individual graphs. Users with admin permission can access global graph settings to set default line colors and widths, as well as global color bands.
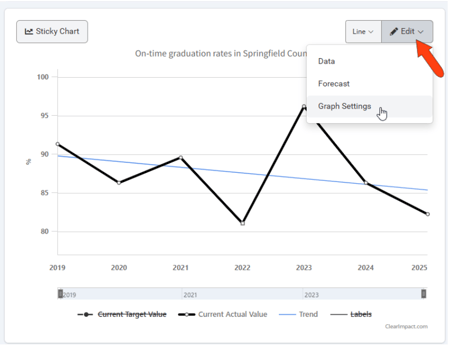
When viewing an indicator or performance measure, if the measure has data entered or calculated, the data line graph appears below the measure name. By default, all data points are displayed, as well as target values if enabled and defined.
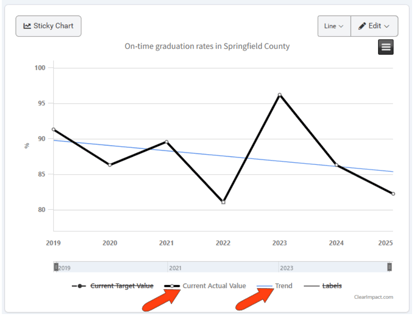
Below the graph is the graph elements key. Elements not displayed, such as trendline in this example, are listed with a strike-through.
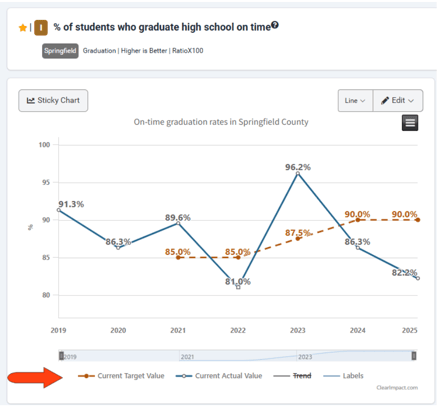
Clicking elements in the graph key toggles their display. In this example, current actual values and trends are displayed, but not target values or data labels.
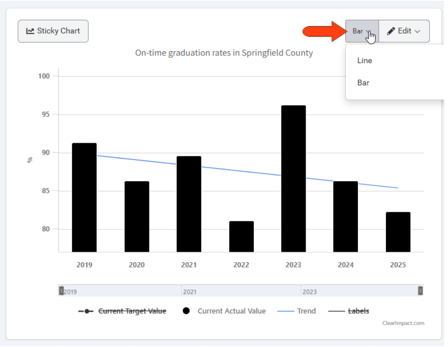
You can also toggle between Line and Bar display.
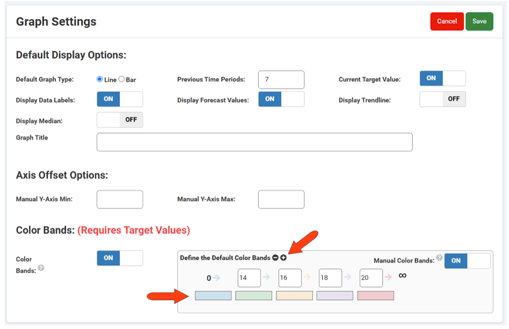
To adjust other display features, click Edit / Graph Settings.
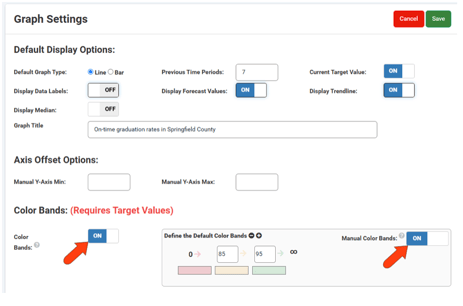
The Graph Settings options control several aspects of the graph display, such as Line vs. Bar, target and forecast values, data labels and trendlines, graph title, etc. Color bands, which are turned on in this example, are assigned based on the percent of each actual value vs its target, so target values need to be assigned for color bands to work. Turning on Manual Color Bands enables you to set your own color band thresholds.
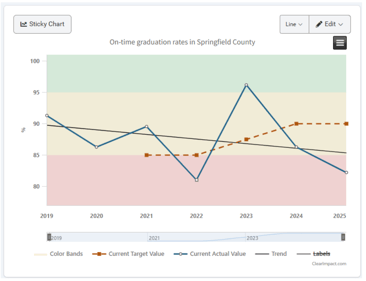
After clicking Save, the graph updates to reflect the new settings.
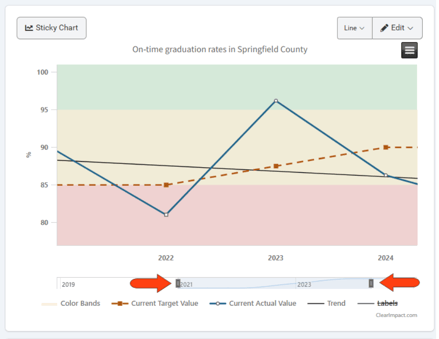
The time sliders below the graph can be adjusted to control the period for which data is displayed.
When color bands are enabled, the relevant colors are also displayed in the measure’s Data tab. (These colors also appear in the scorecard view.)
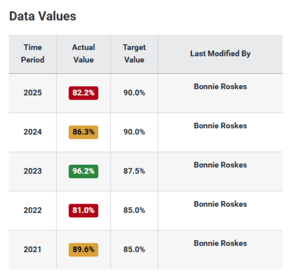
As mentioned above, color band thresholds are based on each data point’s percentage of its target value. Depending on the data type, it is sometimes helpful to add colors and / or manually change thresholds.
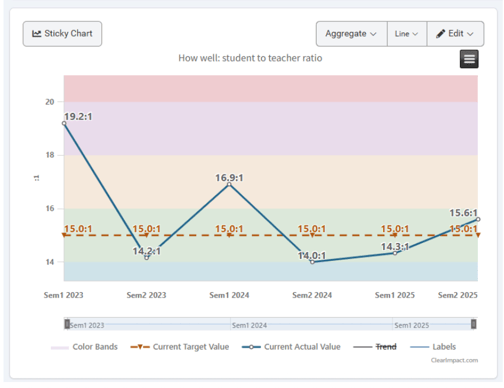
In this example, the measure is a student:teacher ratio with a polarity of Lower is Better. The lowest (best) ratio is 14:1, and the highest (worst) ratio is 19:1. The default color bands shown below don’t present a helpful reading.
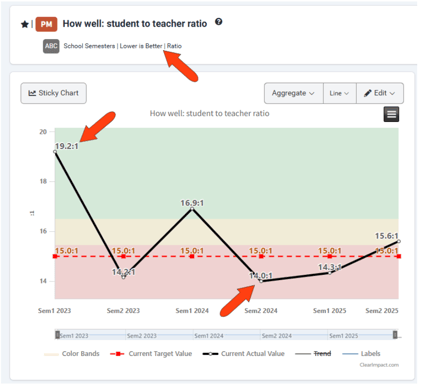
The solution in this example is to add color bands, and change threshold values to better represent the data. This example has more bands, with custom colors and manual threshold values.
After saving changes, the new color bands make it clear that the lower ratios are within to the green / blue range, and higher ratios are approaching red.