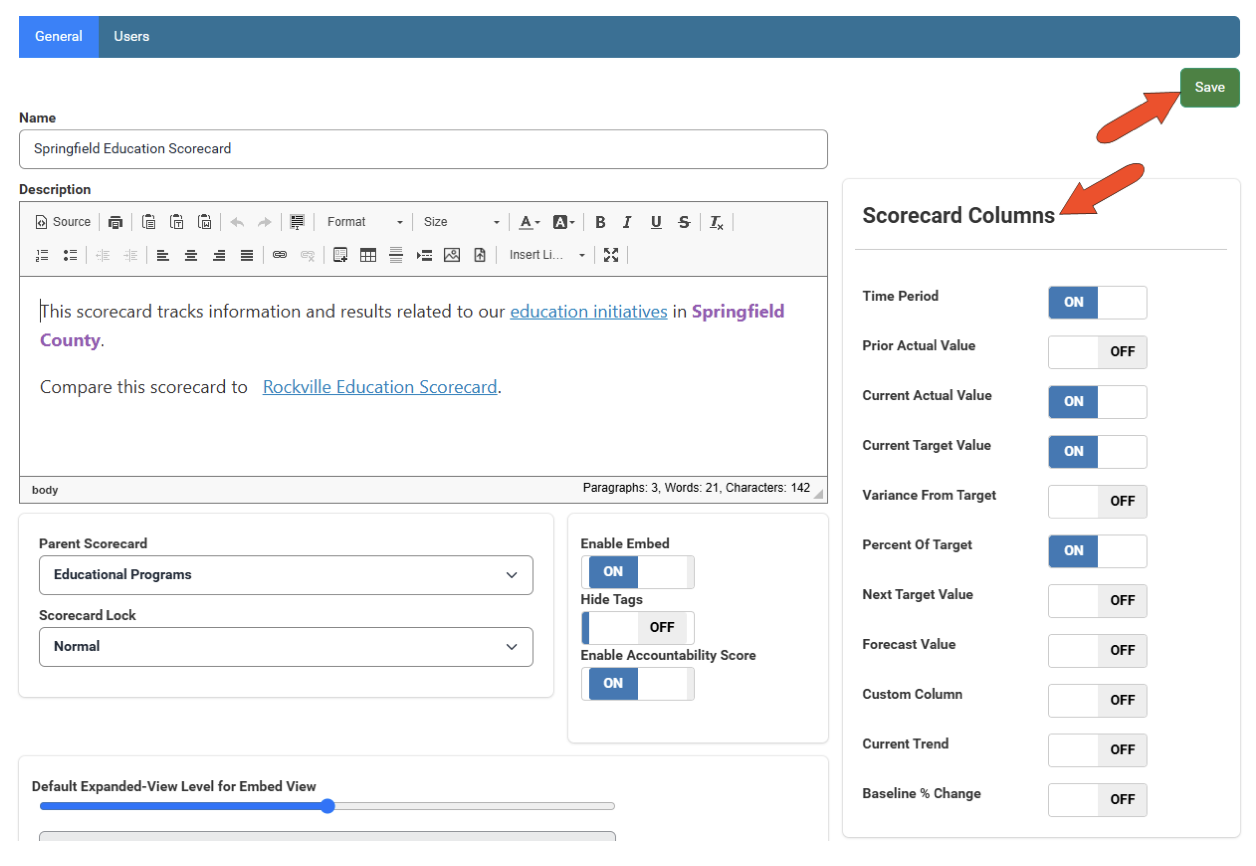
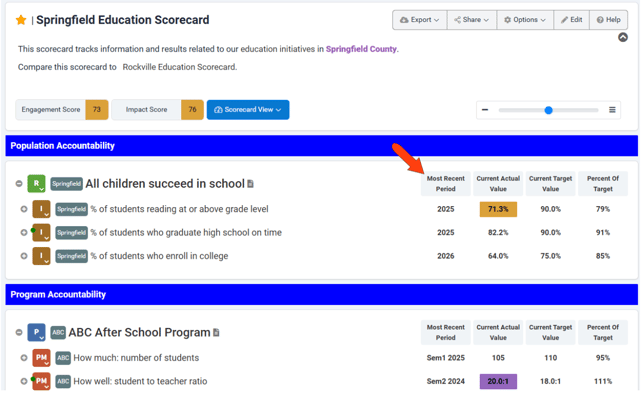
When viewing a scorecard, scorecard columns appear along the right side of each container. These columns display current data for indicators and / or performance measures.
These columns are configured when creating the scorecard. There are 11 columns to choose from, and up to six columns can be displayed at a time, though typically you’ll only need two to four.

The following columns are available:
- Time Period: The time period for the corresponding data.
- Prior Actual Value: The actual value from the time period prior to the current one.
- Current Actual Value: The measured value for the current period.
- Current Target Value: The desired value for the current period.
- Variance from Target: The magnitude of variance between the current actual value and the current target value. ([Actual Value] - [Target Value]) / [Target Value].
- Percent of Target: Percent difference between current actual value and the current target value. (Actual Value / Target Value) *100.
- Next Target Value: The desired value for the upcoming time period.
- Forecast Value: The forecasted value for the upcoming time period.
- Custom Column: Will appear if enabled by your admin
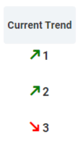
- Current Trend: The current trend of actual values. A green arrow indicates a good direction; a red arrow indicates a bad direction, depending on the polarity of the measure. The number next to the arrow indicates how many periods comprise the current trend.
- Baseline % Change: The percent change of the actual value from the baseline value. [(Current Actual Value - First Entered Actual Value)/First Entered Actual Value].
A green arrow represents a good direction; a red arrow indicates a bad direction, depending on the polarity of the measure.
To change scorecard columns, first edit the scorecard, then click the Edit button at the top.
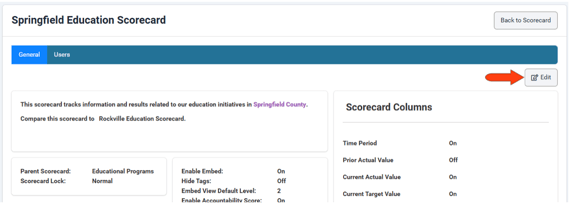
In the Scorecard Columns section, configure the columns you want displayed, and click Save.