Scorecard 2023 Upgrade Notes
Clear Impact has been hard at work in 2023 improving the Scorecard platform, user experience and implementing customer-requested enhancements. See our release notes below for a summary of what we've done this year!
Spring 2023 (March - May)
Scorecard 6.0 Sunset All Scorecard instances have been updated to the Scorecard 7.0 interface featuring clearer navigation and enhanced ease-of-use for users and administrators. Learn more about the Scorecard Dashboard here.
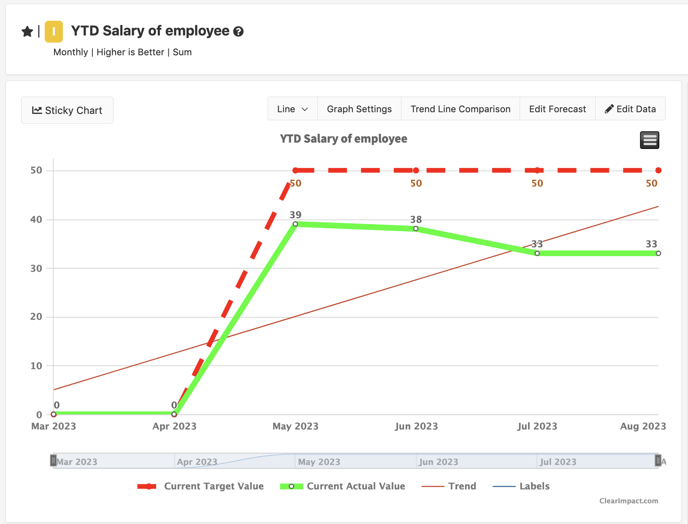
Added ability for manually added min/max values set for the Y-axis to display on a Trend Line comparison chart. Learn more about Graph Settings here.
Min/Max values set for the Y-axis must be applied to the graph settings of the primary measure displaying in the Trend Line Comparison chart in order for those values to successfully display in the Trend Line Comparison view
Min/Max values applied to comparee graph settings will not display in the Trend Line Comparison view
Example of Axis Offset Options Graph Settings
Example of manually set min/max values for Y-axis in Trend Line Comparison view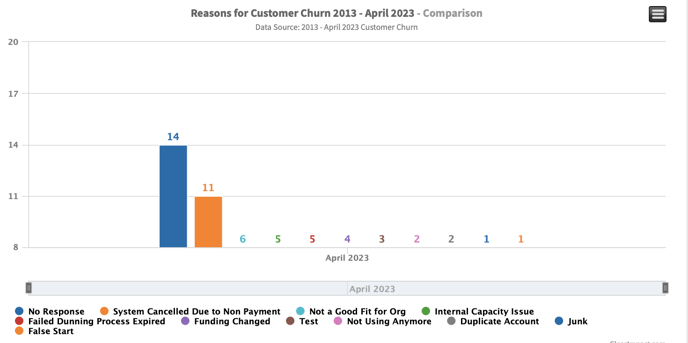
New Feature Embed Views page available in Instance Administrator menu
- What is it? The Embed Views page in the Instance Admin menu allows administrators to track how many views each of their embed pages receives.
- Learn more about Embed Views here
To access the Embed Views log: Go to General Settings in Admin menu under gear icon > Go to "Embed Views" in the admin menu that appears on the left side of the screen when in General Settings > Click "Embed Views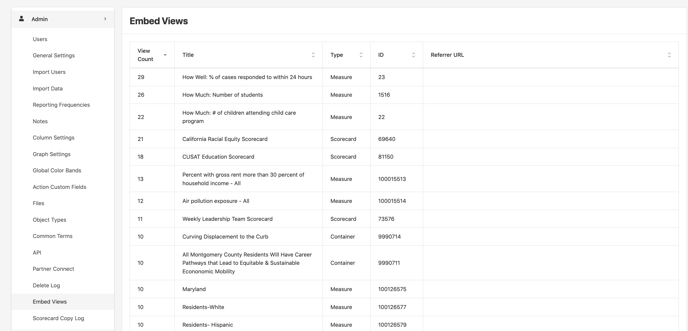
- Learn more about General Settings here.
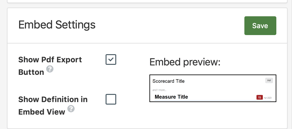
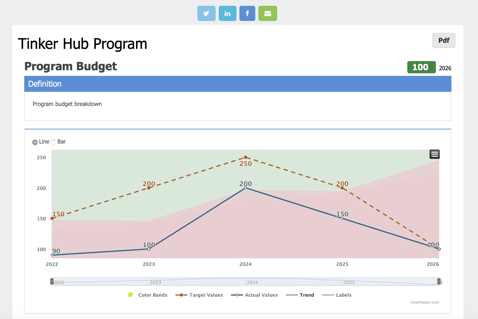
- Learn more about General Settings here.
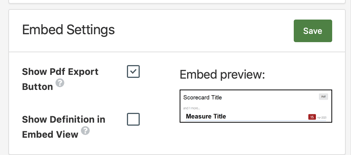
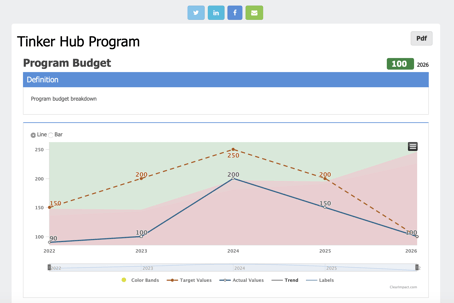
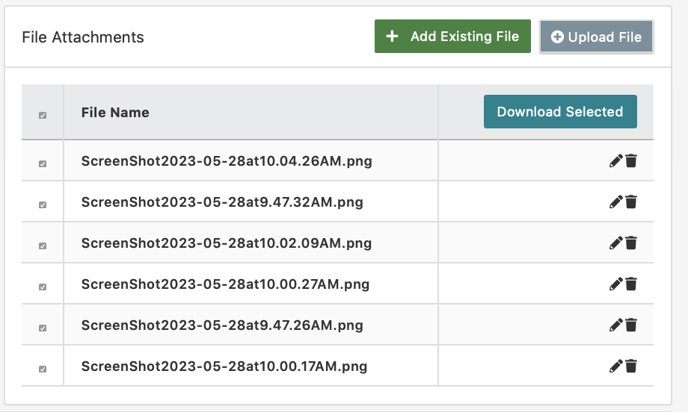
Multiple files selected will download into a zip file. User can also check top check option to select all files in list.
Summer 2023 (June - August)
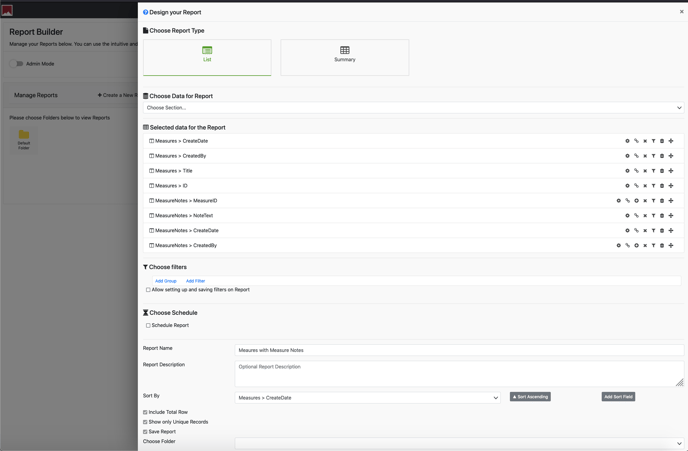
Launched DotNetReporting for subscribed Scorecard customers.
- What is it? The DotNetReporting tool allows administrators or users with specific permission to access a default report library or build reports from that extract data related to Scorecards, Containers, Measures, Actions and To-dos. The reports do can be exported into PDF, Excel, CSV, XML files and downloaded by the end user. The DotNetReporting tool is available for paid subscribers.
- Learn more about Creating Reports here.
Includes: Default Reports and Customer Report Builder
Link to report documentation https://support.clearimpact.com/en/reporting-in-scorecard
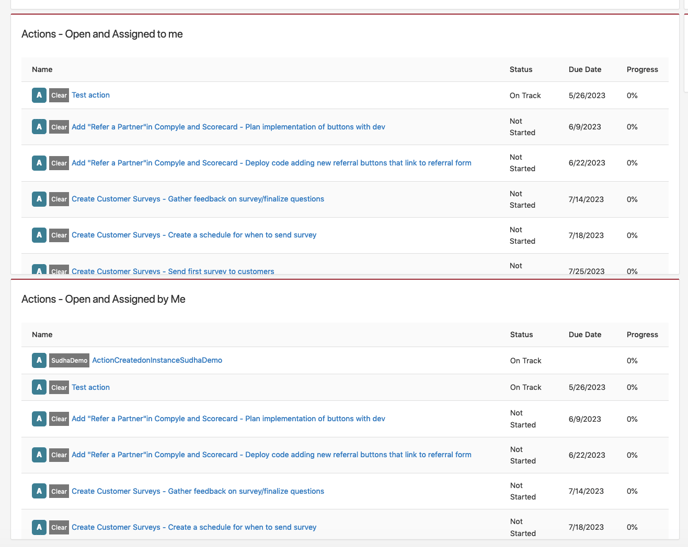
Added Section for "Assigned By" in My Open Actions on Scorecard Dashboard.
- Learn more about the Scorecard Dashboard here.
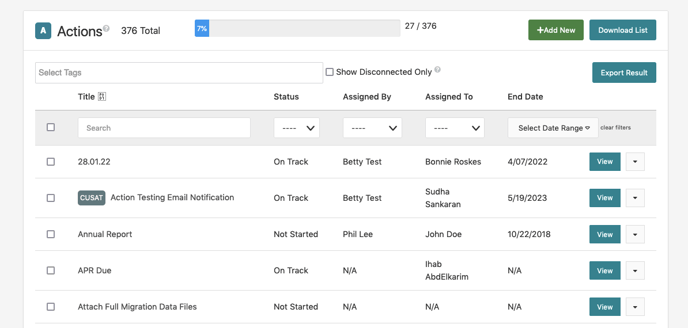
New Feature Variable Measure is now available to support disaggregating measures.
- What is it? The new measure type "Variable Measure" allows users to set up disaggregated measures that will not count against their overall measures allocated per their subscription level. This allows users the ability to add as many disaggregated measures as needed and these will be seen only within the parent measure comparison graph and/or used in calculations for the parent measure. Variable measures save space by not displaying as individual measures on a scorecard, allowing for a more streamlined look and feel.
- Learn more about Variable Measures here.
Getting to Variable Measures
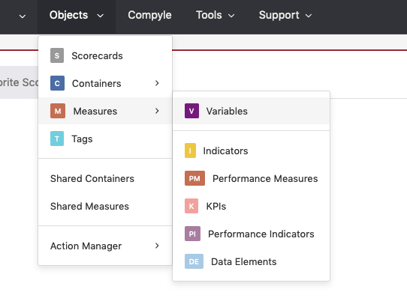
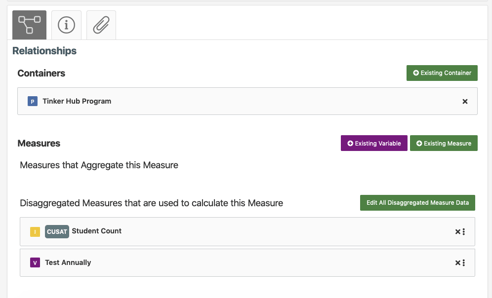
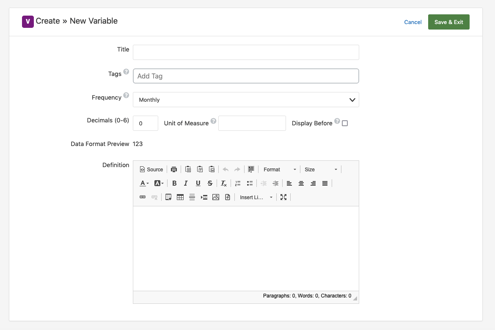
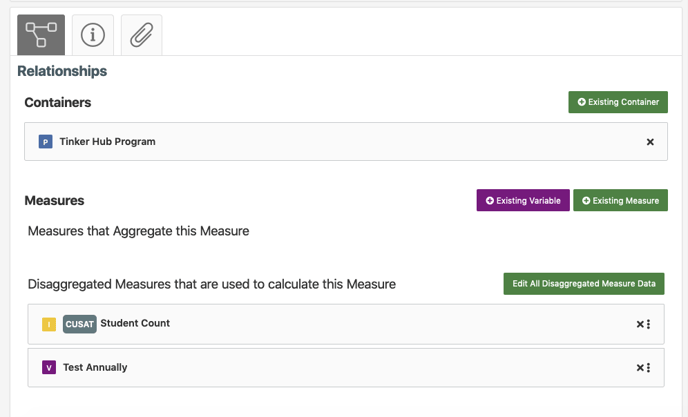
- Learn more about Measure Settings here.

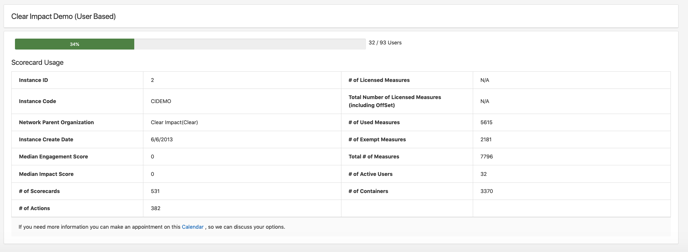
New Feature An Instance Dashboard in now available to Instance administrators through the Instance Admin Menu
- What is it? Instance admin can gain insight into their site activity by viewing the Instance Dashboard to see how close they are to user seat or measure limits allowed within their instance. Parent Instances within a partner connect network can also see how many measure and users each instance has added over time. Instance admin can schedule a meeting with CS team directly from Instance Dashboard.
- Learn more about the Instance Dashboard here.

Fall 2023 (September - November)
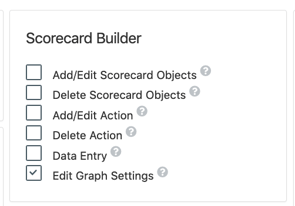
New Feature Access permission for "Edit Graph Settings" to User Access Control.
- Learn more about Setting User Permissions here.
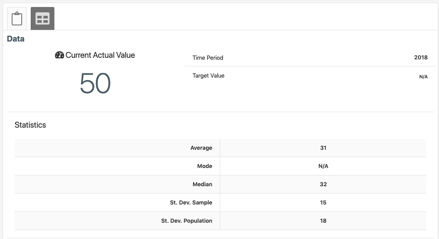
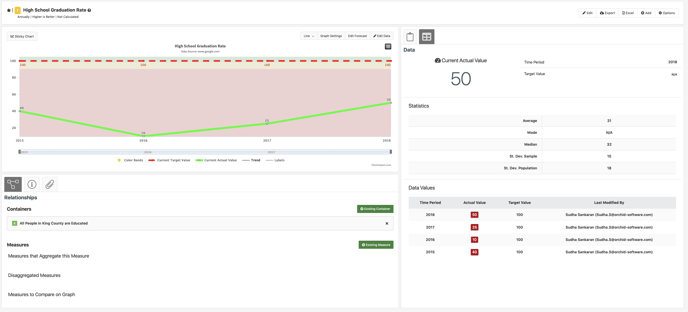
- What is it? The Data tab now automatically displays a "Statistics" section that calculates standard statistical data points including:
Mode
Median
St. Dev. Sample
St. Dev. Population
-
- Learn more about Viewing and Editing Measures here.
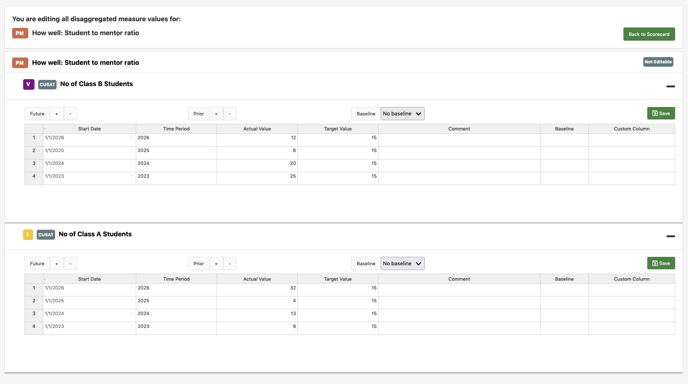
- What is it? When viewing a scorecard, users can update all child measures for a calculation in one place by clicking on the measure icon to access the "Edit Disaggregated Values" shortcut, this will save the user time by opening all of the child measures in one page directly from the scorecard instead of having to navigate to various measures to make updates.
- Learn more about Editing Data in the Scorecard View here.
-

- Once the user clicks the"Edit Disaggregated Values" they will be taken to the edit page for all of the child measures. The user can choose to expand the data entry grid for each measure by clicking the "+" symbol next to the measure. The user will need to click the "Save" button that aligns with each child measure to ensure they're data entry is saved. Once the user has finished updating all of the sections and saving each section, they can then return to the scorecard view by clicking "Back to Scorecard".
- If a measure cannot be edited it will display a "Not Editable" message and is not editable because it is used in another calculation, is part of a locked scorecard or is shared from a different instance
- Collapsed view

- Expanded view
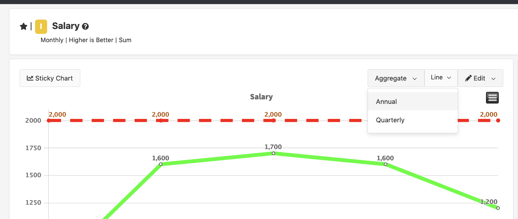
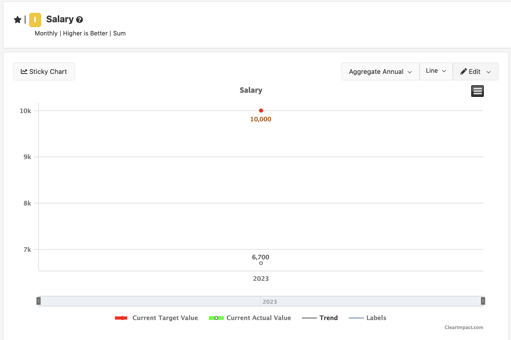
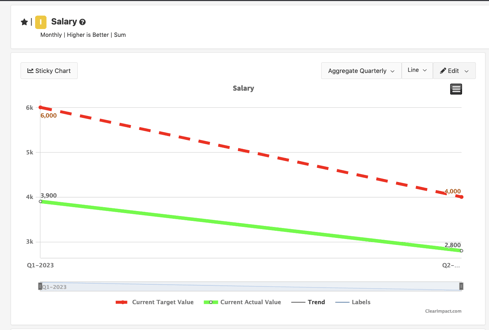
- What is it? An "Aggregate" dropdown option has been added to the Measure graph and now displays above the measure graph on the far left for measures with a reporting frequency of Monthly or Quarterly. The "Aggregate" dropdown allows users to see the measure data displaying in the graph summarized Annually or Quarterly, with an option to "Reset Graph" at any time. This helps the user see Annual or Quarterly totals in one quick look without having to change the reporting frequency related to measures included in a calculation.
- Learn more about Graph Settings here.
- What is it? The new "Percent of Target" column is an easy way for scorecard builders to add a column to a Scorecard that shows the percentage reflecting how far the Actual Value is from the Target Value.
- Learn more through our Scorecard Columns and Column Settings articles!
- Shows difference between current actual value and the current target value. (Actual Value / Target Value) *100
- The "Percent of Target" column can be activated in Scorecard settings
- Learn more through our Scorecard Columns and Column Settings articles!
-
-
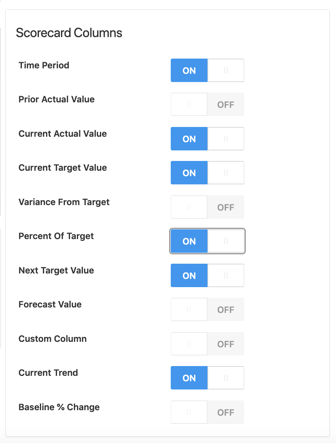
- Once activated for a scorecard the "Percent of Target" column will display in Scorecard-view mode
-

- This new column was added as a result for developing a proof of concept scorecard for a prospective customer
New Feature Added Notifications to Top Navigation Menu
- What is it? In the past, Scorecard users have been sent notifications to their email address associated with their user account but they did not have an alternate method of seeing those notifications within their product. With the new Notification feature they will see a bell icon in the upper right corner of their top navigation bar with a badge that shows how many unread messages are available to view. When the user clicks on the Notification icon and navigates to the Notification page they can click into any message and the badge will update to show only the number of unread messages. The following actions trigger a notifications to the user -
-
- Assigned action
- Monthly or weekly digest
- Completed action
- Added to a different client
- Learn more in the Scorecard Preferences article!Measure Limit
- Notification icon displays for users in top nav to the right of the instance admin menu, icon appears as a bell
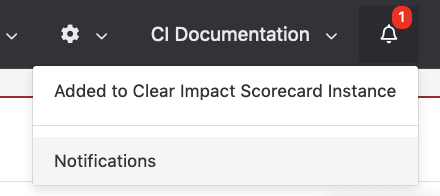
- View of Notification page

- Learn more in the Scorecard Preferences article!Measure Limit
- Assigned action
-
New Feature User Activity list available for Instance Admin
- What is it? The scorecard team has received many requests from internal and external stakeholders to make a User Activity log available for Instance Admin so that they can have better insight into their users' activity. The User Activity list can now be accessed through the User tab from the Instance Administrator menu.
- Learn more in the Scorecard Users help article
-
-
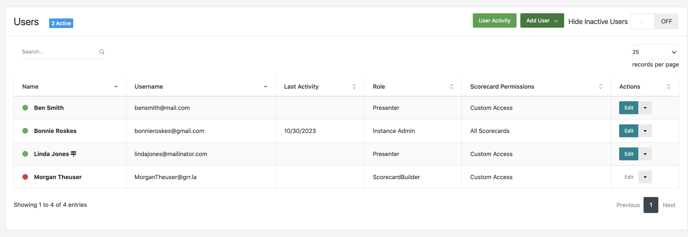
- "User Activity" tab is available to Instance Admin in User page
- User Activity list will show most recent 100 actions with Load More button to show next 100
- Button displays to the left of "+Add New User"
- Pressing button will navigate user to the User Activity page
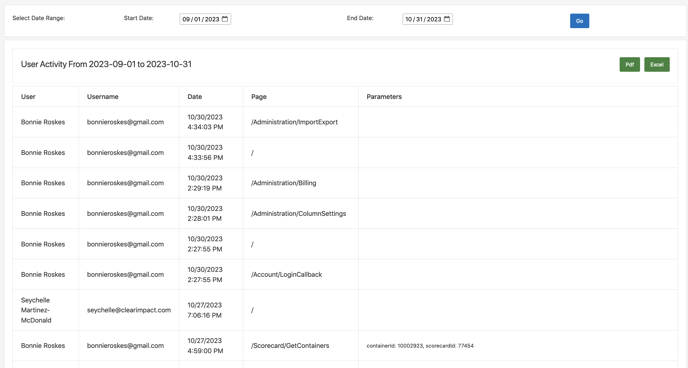
- Start and End Date options will display at top of page with default for most recent full month
- "Go" button will display to the right of the Start Date and End Date inputs
- User can adjust search date range and search for one month at a time
- Page displays results once user click "Go"
- Results page contain link to export full list as PDF or Excel
- Activity Log will also display for each user when Instance Admin is viewing the User Permissions page
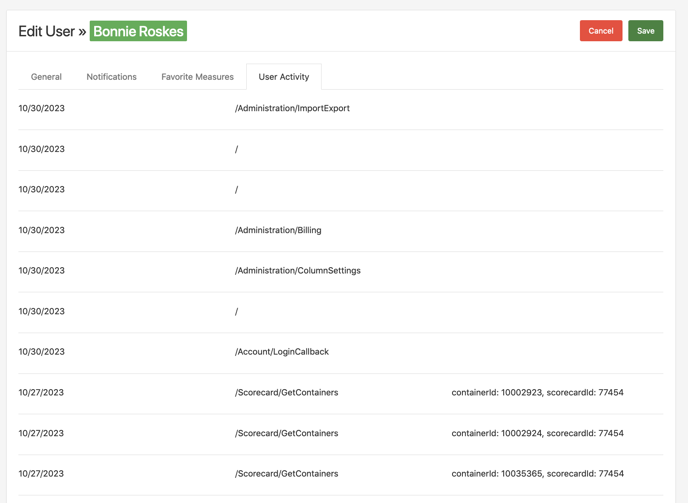
- "User Activity" tab is available to Instance Admin in User page
-
Winter 2023 (December - Last Release of 2023)
NEW
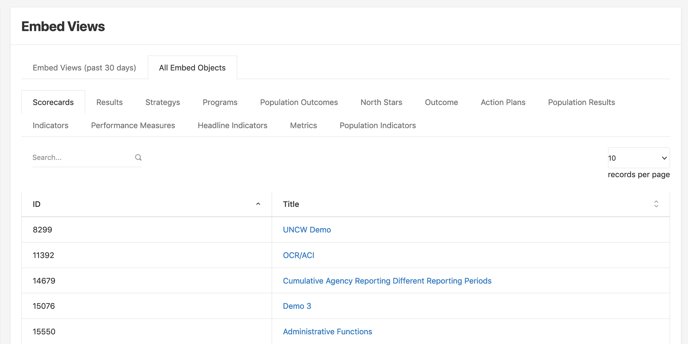
New Embed View tool (located in the Instance Administrator menu) has been expanded to include the following -
- Embed Views page now contain Embed Object URL as hyperlink for each listed Object
- Additional Tab has been added to show all embedded objects for each Object type
- Embed View is now showing two tabs
- "Embed Views (past 30 days)"
- "All Embed Objects"
- Embed View is now showing two tabs
- Embed Views (past 30 days)
- Shows
- Object ID
- Object name hyperlinked with URL
- Object Type
- Referral URL
- "Records per page" dropdown
- Shows
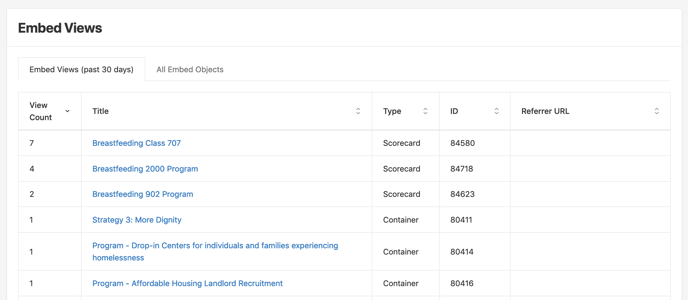
- Shows tab for each type of embedded object
- Each Embedded Object Tab Shows:
- Object ID
- Object name hyperlinked with URL
- "Records per page" dropdown
